The largest enlargement of the European Union took place on April 1, 2004, when 10 new member states joined the European community, among them Poland. Later, in 2007, Bulgaria and Romania joined the EU, and in 2013 — Croatia. More than 20 years have passed since then. The question of what achievements Poland has made and what challenges its economy has faced within the European Union determines the relevance of this study.
The countries of Central and Eastern Europe went through a complex process of transforming their political and economic systems. On the eve of their accession to the European Union, candidate countries undertook large-scale harmonization of national legislation and modernization of their economies in accordance with European law requirements. In particular, comprehensive reforms were implemented in environmental legislation, social policy, and education, wastewater treatment systems were modernized, and modern environmental filters were installed at power plants. The process of adaptation to EU standards has contributed to positive structural changes in various spheres of public life.
Immediately before the enlargement of the European Union, both optimistic expectations and certain reservations prevailed in the old member states and in the candidate countries. Supporters of integration processes emphasized the potential for opening new markets and expanding production capabilities within the single European space. At the same time, legitimate questions arose regarding the readiness of the new members for full integration, as well as the possible impact of enlargement on the functioning of institutional mechanisms and decision-making procedures established in the European Union.
Poland’s accession to the European Union in 2004 brought numerous positive economic effects, as confirmed by statistical data and academic research:
Significant EU financial support: From 2004 to 2023, Poland received €245.7 billion from the EU, with a net balance (after deducting membership contributions) of €161.9 billion. About 65% of these funds were allocated to cohesion policy, enabling the modernization of transport, energy, and social infrastructure.
Intensive economic growth following EU accession is evident in the dynamics of key macroeconomic indicators: GDP per capita growth rates exceeded the European average, rising from USD 6,500 in 2004 to over USD 22,000 in 2023. Econometric models indicate that without EU integration, GDP per capita could have been 31% lower, underscoring the decisive role of EU membership in transforming the country’s socio-economic landscape.
Improvement in living standards: The unemployment rate fell from over 19% in 2004 to one of the lowest in the EU in 2023. Wages increased by 213%, and the purchasing power of Poles more than doubled.
Growth in foreign trade: EU membership opened European markets to Polish goods, resulting in the highest growth in export share among the EU-27 countries.
Infrastructure development: Massive investments made it possible to build new highways, modernize roads, and expand regional airports, significantly increasing the competitiveness of the Polish economy both within the EU and in the global market.
Social benefits: Approximately 80% of Poles believe that EU membership has had a positive impact on the economy, and 70% have personally experienced an improvement in their living conditions.
The attraction of foreign direct investment: Poland’s integration into the European Union served as a catalyst for a significant increase in foreign direct investment, which contributed to the modernization of the national economy and the creation of new jobs.
Labor mobility: The introduction of the free movement of labor within the European Union provided Polish citizens with opportunities for employment and education in EU countries, which helped reduce unemployment and increase the volume of remittances to the national economy.
GDP per capita growth dynamics in Poland (2000–2024).
An analysis of GDP per capita growth indicators in Poland, the EU, and neighboring countries (Table 1; Fig. 1) reveals that Poland’s integration into the EU has had a positive impact on this macroeconomic indicator, despite a decline in GDP per capita from 2012 to 2016. The global financial crisis of 2008 was the main cause of the downturn; however, compared to 2016 (USD 12.46 thousand), the figure had almost doubled by 2024 (USD 22.05 thousand). Forecast calculations for 2027 indicate continued positive GDP per capita growth in Poland to USD 26.81 thousand.
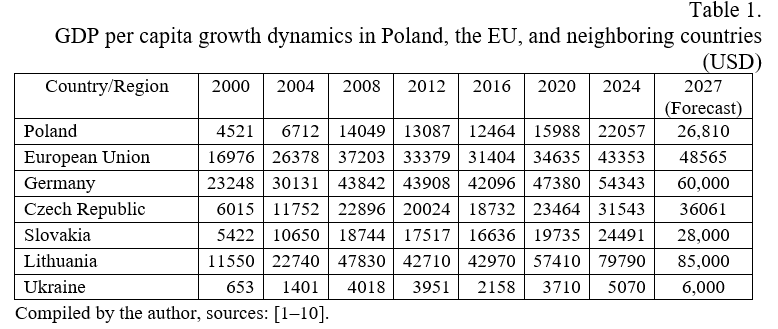
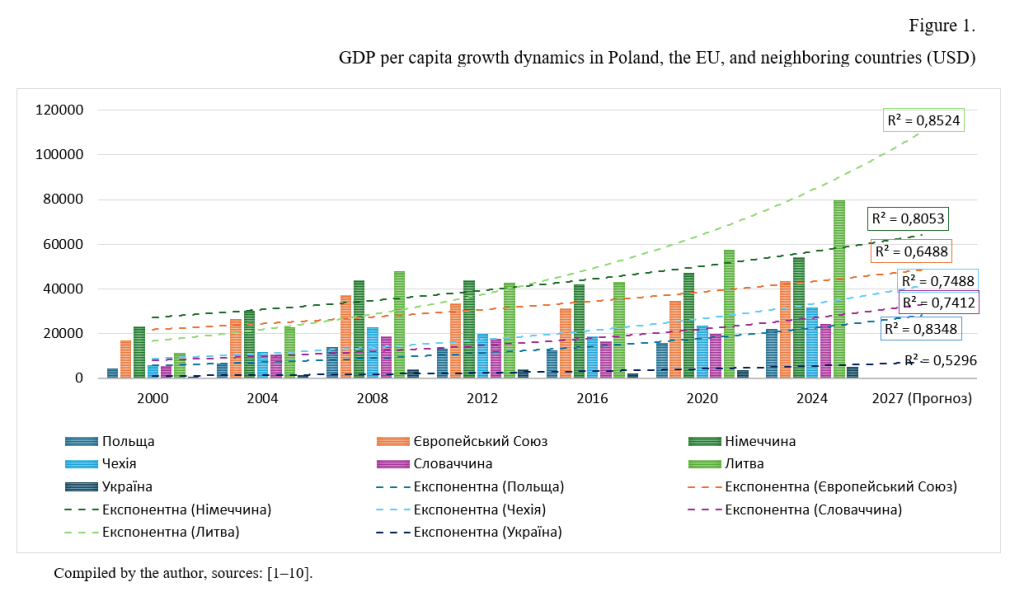
Figure translation
- Poland
- European Union
- Germany
- Czechia
- Slovakia
- Lithuania
2027 (Forecast)
Between 2000 and 2008, there was a significant increase in GDP per capita, driven by the implementation of structural reforms aimed at harmonizing the Polish economy with European standards. In particular, between 2000 and 2004, Poland’s GDP per capita increased from USD 4,520 to USD 6,710, representing a 57% rise. Poland’s official accession to the European Union in 2004 had an additional impact: by 2008, GDP per capita had risen to USD 14,050, representing over 100% growth. This dynamic can be explained by the opening of Polish markets, increased foreign investment, and the inflow of financial resources from EU integration support funds [11–13].
The 2008 financial crisis led to a decline in Poland’s GDP per capita from USD 14,050 to USD 13,080 in 2012. However, by 2024, this figure had doubled, reaching USD 22.057 thousand, which indicates the resilience and adaptability of the country’s economic model. At the same time, an analysis of the ratio of Poland’s GDP per capita to the EU average reveals the following trend: in 2004, Poland’s GDP per capita stood at USD 6,710, while in the EU it was USD 26,380 — or 25% of the EU average. By 2024, this ratio had risen to USD 22.06 thousand in Poland, compared to USD 43.35 thousand in the EU, accounting for 50% of the European average [11–13].
Thus, it can be stated that the process of European integration has had a significant impact on Poland’s economic development: between 2004 and 2024, GDP per capita grew by 217% (12). It is essential to note that, although Poland’s absolute GDP per capita remains lower compared to some neighboring EU member states, its growth rates are higher. In particular, over the past two decades, Poland — like Lithuania — has almost quadrupled its GDP per capita, while the corresponding increase in Germany was 1.8 times, in the Czech Republic — 3 times, in Slovakia — 2.4 times, and in Ukraine — 3.5 times (taking into account the period of Russian military aggression). However, Poland’s figures remain significantly lower than those of its neighboring countries, even when compared with Slovakia.
The analysis of the presented dynamics indicates that following Poland’s accession to the European Union, there has been a steady increase in GDP per capita. The process of economic convergence with Western European countries has accelerated significantly, resulting in a fourfold increase in this indicator over the past twenty years. Forecast calculations suggest that by 2027, Poland, along with other new EU member states, will reap substantial benefits from the maturation of their transitional economies and the impact of integration processes resulting from EU accession.
In the medium term (2025–2027), Poland is expected to maintain its stable growth trajectory. The IMF projects that by 2030, Poland will surpass several developed countries (such as Israel, Spain, New Zealand, and Japan) in GDP per capita (in purchasing power parity terms) [14]. This points to strong growth in nominal GDP per capita. The continued utilization of EU funds (including next-generation funds), strong domestic consumption, a skilled labor force, and the expansion of the industrial base are expected to contribute to this growth. However, potential challenges include inflationary pressure, labor shortages, and a slowdown in the global economy.
European integration has become a key catalyst for Poland’s economic development. However, further growth will depend on the implementation of innovative transformations and the overcoming of structural imbalances in the economy. This growth has been achieved through the mobilization of EU resources, the expansion of foreign trade, an increase in foreign direct investment, and improvements in the institutional environment. According to current estimates, if the national recovery plan under Next Generation EU is successfully implemented, Poland could reach 65–70% of the EU average GDP per capita by 2030 [15]. Even during global downturns, Poland has demonstrated resilience. Forecasts indicate continued convergence with Western European economies.
Germany’s GDP per capita, as well as the EU’s weighted average, reflects the significant influence of the German economy on overall European macroeconomic indicators. Germany’s GDP per capita exhibits a steady growth pattern typical of developed economies, with growth rates that are more moderate compared to those of new EU member states. Minor fluctuations recorded in certain years (notably in 2012 and 2016) reflect the effects of global or regional macroeconomic challenges for the eurozone. Overall, the European Union continues to maintain a high level of economic integration, which underpins the functioning of an efficient single market, the development of an institutional framework, and the adoption of innovative technologies.
The Czech Republic and Slovakia, like Poland, have also undergone successful post-communist transformations and have greatly benefited from their accession to the EU. Their GDP per capita growth paths are similar to those of Poland, showing strong convergence with the EU average. They are integrated into regional and European supply chains, particularly in manufacturing (such as the automotive industry).
The Republic of Lithuania, like other Baltic EU member states, is distinguished by a high rate of economic growth, especially between 2016 and 2024. The relatively smaller scale of Lithuania’s economy, compared to Poland, allowed it to adapt structural reforms more rapidly — this, combined with the advantages of European integration, has ensured substantial progress in the country’s socio-economic development.
The dynamics of GDP per capita in Ukraine have been significantly affected by geopolitical factors. Despite some growth up to 2012, subsequent events — in particular, the annexation of Crimea, the armed conflict in the Donbas since 2014, and the full-scale military aggression of the Russian Federation in 2022 — have had a severely negative impact on the country’s economic potential. The forecast for 2027 remains highly uncertain and depends on the resolution of the conflict as well as the implementation of measures for economic recovery. Under a “rapid and favorable conflict resolution” scenario, a substantial volume of international aid and investment directed toward reconstruction could ensure rapid GDP per capita growth (albeit from a low starting point). At the same time, a prolonged conflict or continued instability would significantly constrain the prospects for economic recovery and further growth.
2. Budget deficit and public debt of Poland in relation to GDP
Despite growth, the countries of Central and Eastern Europe have been unable to significantly close the GDP per capita gap with the most developed EU countries, such as Germany and France. The region’s leaders (Czechia, Hungary, and Slovenia) have made virtually no progress over the past decade.
Within the economic structure, processes of deindustrialization and simplification of production capacity have occurred, resulting in a decline in competitiveness in both global and European markets. A significant share of foreign investors have used Central and Eastern European countries primarily as assembly platforms rather than as locations for the development of high-tech industries.
Issues with Poland’s budget deficit and public debt: As a result of high budget deficits and significant public spending, including on defense and social programs, Poland’s state budget deficit in 2024 reached 6.6% of GDP, while the debt-to-GDP ratio is rising and is projected at 58% in 2025 and 65.3% in 2026 [16].
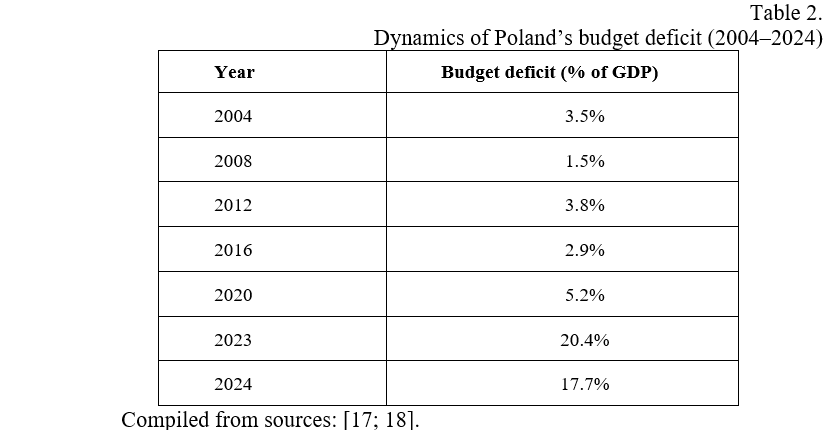
According to the latest data (Table 2), in 2023–2024, the deficit increased sharply due to the COVID-19 pandemic, military spending, and social programs [19].
The growth of Poland’s budget deficit in 2023–2024 was driven by several factors (Table 2):
First, there has been an increase in public spending on social programs, healthcare, and defense, driven by current military threats in the region.
Second, the COVID-19 pandemic significantly impacted the budget, resulting in both a reduction in revenues and an increase in expenditures to support the economy.
Third, an additional factor is rising inflation and higher energy costs, which have intensified budgetary needs.
Fourth, economic stimulus policies play an important role through increased public investment and social benefits.
Fifth, part of the deficit is financed through external borrowing.
Possible implications for Poland’s current economy:
A significant budget deficit puts substantial pressure on public finances, increasing the risk of inflationary processes. This situation highlights the need to balance the budget in the medium term, which may require the introduction of stricter fiscal measures. The growth of the deficit also limits the financial capacity for implementing investment projects and funding social programs.
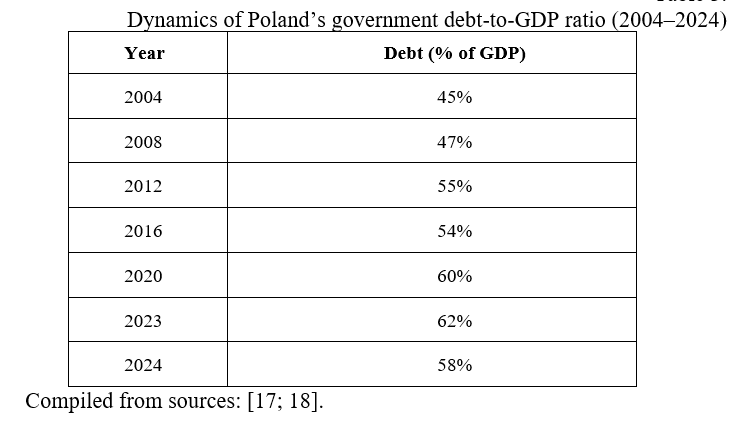
Explanation of public debt growth indicators (Table 3):
The increase in the state budget deficit necessitates the attraction of additional credit resources to cover budgetary obligations.
The rise in spending on defense and social programs following EU accession, particularly in response to growing security risks, has contributed to the accumulation of the debt burden.
Economic shocks, such as the COVID-19 pandemic, have led to a substantial increase in public spending and intensified debt pressures.
The need to finance large-scale infrastructure projects and modernization has also driven borrowing.
Potential implications for Poland’s current economy (Table 3):
An increase in public debt raises the level of financial risk and, at the same time, limits the government’s fiscal capacity to implement economic policy. This creates the need for fiscal policy aimed at stabilizing the debt burden and ensuring macroeconomic stability. High debt volumes may negatively affect the country’s credit rating and increase the cost of external and domestic borrowing.
Potential consequences for the modern Polish economy (Table 3):
The growth of public debt increases the level of financial risks and, at the same time, limits the government’s budgetary capabilities to implement economic policy. This necessitates the implementation of fiscal policy aimed at stabilizing the debt burden and ensuring macroeconomic stability. High levels of debt can negatively impact a country’s credit rating and increase the cost of both external and internal borrowing.
General conclusions:
A high budget deficit forces the government to seek additional sources of financing, which may lead to higher taxes or cuts in social spending, negatively affecting economic growth and the population’s well-being. The budget deficit also complicates Poland’s fulfillment of its obligations within the EU, particularly in terms of complying with fiscal rules and maintaining eurozone stability. These issues are typical for countries undergoing a period of adjustment after joining the EU, especially under conditions of increased military spending and social commitments.
The high level of budget deficit prompts Poland’s public authorities to look for alternative sources of financing, which in turn may result in increased tax burdens or reductions in social spending. Such measures can negatively impact the pace of economic growth and the standard of living of the population. Furthermore, the rising budget deficit complicates Poland’s ability to fulfill its obligations within the European Union, particularly in terms of adhering to fiscal rules and maintaining the stability of the eurozone.
These challenges are characteristic of countries in the post-integration adaptation phase following EU accession, especially under conditions of growing military expenditures and expanding social commitments.
3. Impact of the EU Enlargement on Poland’s Foreign Trade (2004–2025)
Following Poland’s accession to the European Union, the country was compelled to implement structural changes in its economic system, which brought about both positive and negative consequences.
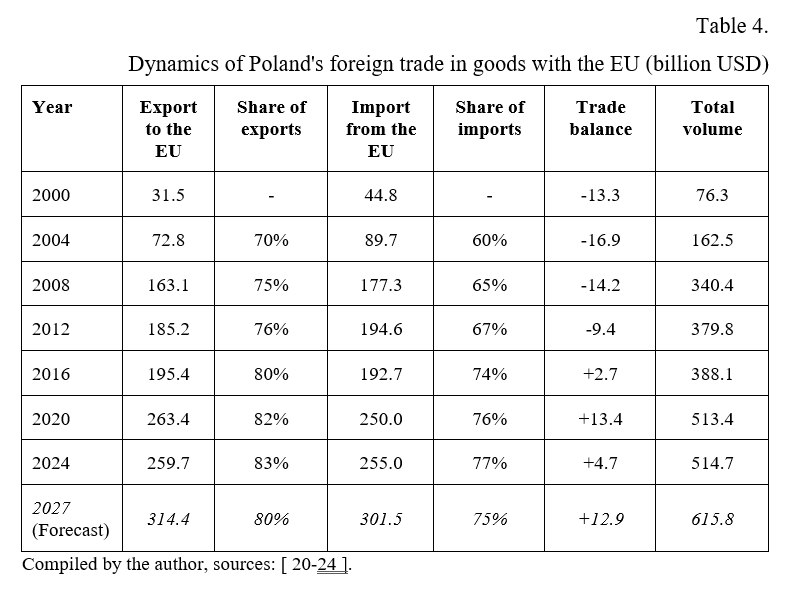
Following Poland’s accession to the European Union in 2004, significant transformations took place in the structure of its foreign trade. The liberalization of trade policy, particularly the removal of customs duties and non-tariff barriers, led to significant growth in trade volumes with EU member states. As shown in Table 2, Poland’s exports to EU countries have consistently remained high, fluctuating within the range of 70–80%, while the share of imports has remained within the corridor of 60–75%, respectively. At the same time, there has been a trend towards diversification of export flows beyond the European Union — particularly to the economies of Asia, North America, and other regions — in order to mitigate risks associated with excessive dependence on a single market. According to forecast calculations for 2027, a further decrease in the share of exports and imports to EU countries is expected, while maintaining the overall positive dynamics of foreign trade turnover.
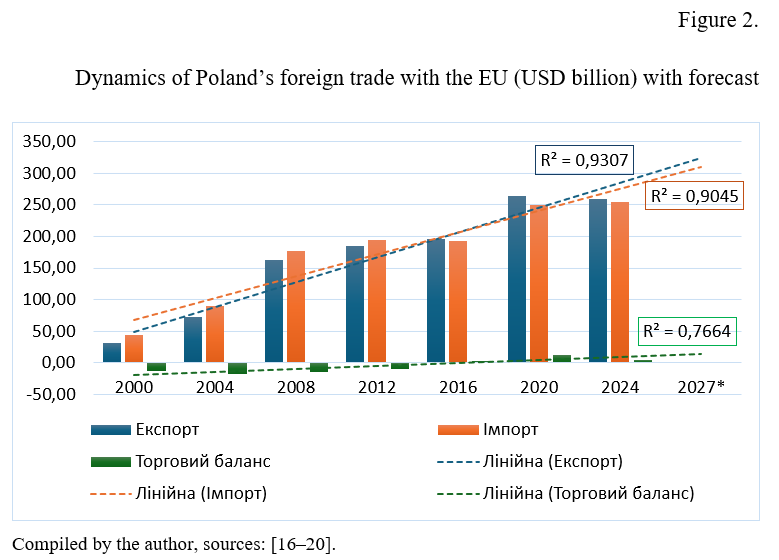
Figure translation
- Export
- Import
- Trade balance
- Linear (Export)
- Linear (Import)
An analysis of the data presented in Table 2 and Figure 2 reveals that, prior to Poland’s accession to the European Union, the country had a negative foreign trade balance with EU member states, a trend that persisted throughout the 2000–2016 period.
However, as Polish industry became more competitive and integrated into European supply chains, particularly in manufacturing (for example, cars, machinery, electronics, furniture), Poland transformed into a net exporter to the EU. This shift, observed between approximately 2010 and 2014, indicates the maturation of Poland’s export-oriented economy and its successful utilization of EU membership to strengthen its industrial base and enhance export potential.
The highest level of positive trade balance was achieved in 2020. However, in 2024, there was a decline in Polish goods exports to EU countries by almost USD 4 billion, resulting in a decrease in the foreign trade balance indicator by USD 8.7 billion. The steady trade surplus with the EU since then underscores Poland’s strong position as a manufacturing hub and a reliable supplier in the European value chain [16].
Linear forecasting of Poland’s foreign trade dynamics with European Union countries for 2027, based on a 24-year data analysis, confirms the continuation of positive trends across all key indicators. Further growth in export and import volumes, the maintenance of a positive foreign trade balance, and an increase in the total trade volume to over USD 615 billion are projected. Forecast calculations for 2027 indicate a further strengthening of Poland’s position as an exporter within the EU; however, to maintain stable, positive dynamics, it is necessary to expand sales markets and intensify investment in high-tech sectors of the economy.
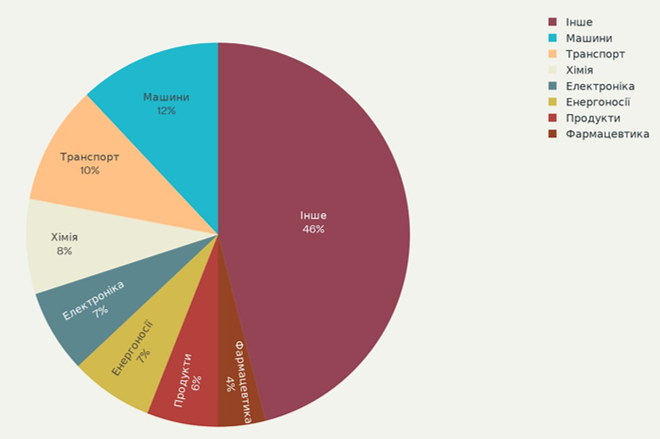
Figure 3.
Structure of Poland’s exports of goods to the EU in 2000 (USD billion)
Compiled by the author, sources: [5; 16; 25].
Figure translation
- Other
- Machinery
- Transport
- Electrical engineering
- Food products
- Furniture
- Metal products
- Clothing
Figure 4.
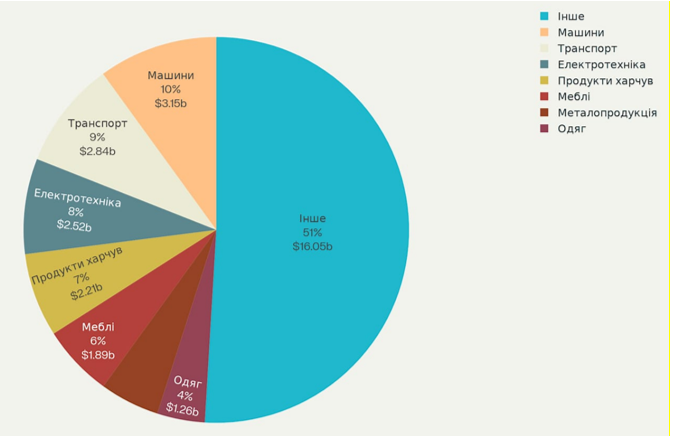
Structure of Poland’s imports of goods from the EU in 2000 (USD billion)
Compiled by the author, sources: [5; 16; 21].
Figure translation
- Other
- Machinery
- Transport
- Chemicals
- Electronics
- Energy carriers
- Food products
- Pharmaceuticals
As shown in Figure 3, in 2000 (before Poland’s accession to the EU), the total volume of goods exports amounted to USD 31.5 billion, with more than half of the export structure accounted for by the miscellaneous “Other” category, indicating a fragmented and insufficiently specialized product range. Among the main groups of exported goods, machinery and equipment (10%), transport vehicles and components (9%), and electrical products (8%) were the most prominent. A significant share of food products and furniture reflected the presence of competitive advantages in labor-intensive and agricultural sectors, which was characteristic of the initial stage of Poland’s integration into the European Economic Area.
As shown in Figure 4, in 2000 (the period before Poland’s accession to the European Union), the total volume of goods imports amounted to USD 44.8 billion. The main categories of imported products included machinery and equipment (12%), transport vehicles (10%), and chemicals and electronics (a total of 15%). At the same time, a significant share of energy resources (7%) indicated a considerable dependence of the Polish economy on external energy sources during that period.
In 2000, the structure of Poland’s foreign trade in services with European Union countries was characterized by the features of the initial phase of integration. Key competitive advantages were transport and construction services, while the financial sector and high-tech industries remained largely dependent on imports. The negative balance of foreign trade in goods, at –USD 13.3 billion, was due to significant imports of equipment and technological components necessary for the modernization of the national production complex.
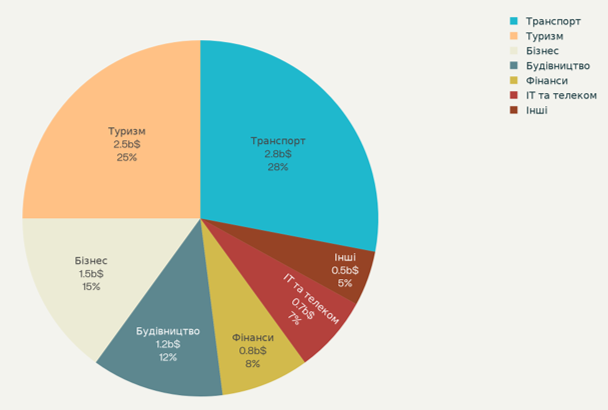
Figure 5.
Structure of Poland’s exports of services to the EU in 2000 (USD billion)
Compiled by the author, sources: [5; 16; 25]
Figure translation
- Transport
- Tourism
- Business
- Construction
- Finance
- IT and telecom
- Other
In 2000, Poland’s exports of services to European Union countries (Figure 5) totaled USD 10 billion. The main items of export were transport services (USD 2.8 billion or 28%) and tourism services (USD 2.5 billion or 25%), which together accounted for more than half of its structure. This situation highlights Poland’s competitive advantages in the transportation sector, stemming from its favorable geographical location, low logistics costs, and effective utilization of its transit potential. Other areas of export, such as business, construction, financial, IT, and telecommunications services, remained relatively small but laid the groundwork for further diversification of the export structure and an increase in the share of higher-value-added services.
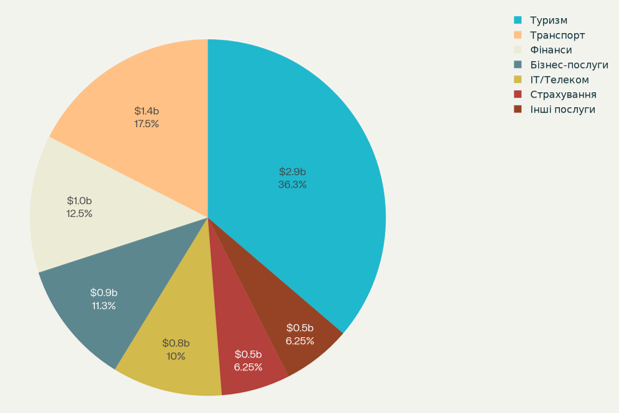
Figure 6.
Structure of Poland’s imports of services from the EU in 2000 (USD billion)
Compiled by the author, sources: [5; 16; 21].
Figure translation
- Tourism
- Transport
- Finance
- Business services
- IT/Telecom
- Insurance
- Other services
The volume of service imports from European Union countries (Figure 6) in 2000 totaled USD 8 billion, with the structure of imports differing from that of exports. Tourism services held the dominant position, with a volume of USD 2.9 billion, accounting for 36% of the total. Second place was held by transport services — USD 1.4 billion (17%). At the same time, a significant share of financial, business, and IT services (together over 33%) reflected the technological and capital dependence of the Polish economy on more developed EU partners.
Based on the indicators of the structure of Poland’s foreign trade with the EU in 2000, the following conclusions can be drawn:
- The surplus in services (+USD 2 billion) offset the deficit in trade in goods. The surplus in transport, construction, and business services partially compensated for the negative goods trade balance, improving the current account.
- Transport is a key driver of exports. Poland utilized its transit location between the Baltic Sea and Central/Eastern Europe. The development of the Gdansk–Gdynia ports and the road/rail network ensured steady demand for Polish logistics services.
- Imports of tourism and financial services indicate an “outflow” of wealth. High spending by Poles on travel to Western Europe and the purchase of financial products abroad meant missed opportunities for the domestic hospitality industry and banking sector.
- Consequences for further integration into the EU:
- Positive: High revenues from the transport and construction sectors will become a resource for modernizing Poland’s fleet, vehicle stock, and infrastructure in the future.
- Negative: Technological dependence in financial, IT, and insurance services maintained the gap between Poland and the “old” EU members.
Over the course of two decades, Poland’s foreign economic activity has demonstrated significant qualitative transformations under the conditions of EU membership. Between 2004 and 2024, the structure of Poland’s exports and imports of goods exhibits clear positive trends, reflecting the country’s growing integration into the EU’s internal market and the strengthening of Poland’s economic position in the European space.
As shown in Table 5, more than one-third of Poland’s exports of goods to EU countries are high-tech goods, primarily machinery, electronics, and car components. This is the result of the deep integration of Polish industrial enterprises (in particular, such companies as Volkswagen, Stellantis, LG, and Samsung) into the European Union’s production chains. Traditional labor-intensive industries, such as furniture and plastics manufacturing, maintain a share of around 13%, which is attributed to their competitiveness due to relatively low labor costs. At the same time, a decrease in the share of exports from the energy and raw materials complex has been recorded: the total share of iron, steel, and fuel is 7–9%, whereas in the period before Poland’s accession to the EU, this figure exceeded 14% [26].
Table 5. Structure of Poland’s trade in goods for 2024
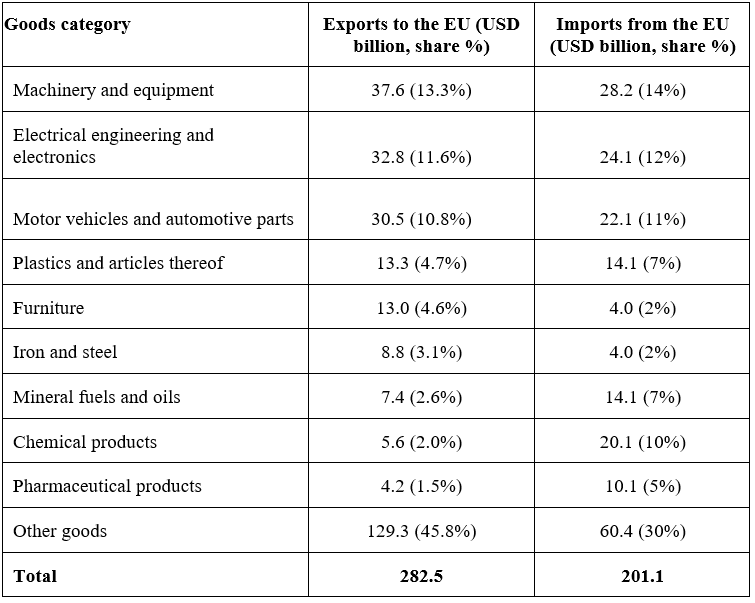
Constructed by the author, sources [27–29].
As for the import component, its structure is dominated by investment and innovation-intensive goods (machinery, electronics, chemicals, pharmaceuticals) — a total of over 51%. This indicates technological dependence on Western European suppliers. The high share of mineral fuels (7%) remains a vulnerable point despite diversification through LNG terminals and supplies from Scandinavia. The surplus (+USD 81 billion) is provided by manufactured goods with high added value, while the deficit is concentrated in energy- and chemical-intensive items.
Poland’s import structure is dominated by investment and knowledge-intensive goods, including machinery, electronics, chemicals, and pharmaceuticals, which together account for over 51% of the total. This reflects technological dependence on suppliers from Western Europe. A significant share of mineral fuels (7%) remains a vulnerability factor, despite diversification through the commissioning of LNG terminals and the expansion of supplies from the Scandinavian region. The foreign trade surplus, which amounts to over USD 80 billion, is primarily formed by exports of processed goods with high added value, while the deficit is observed mainly in categories of energy- and chemical-intensive goods [30–32].
So, we can highlight the following key positive trends in the development of Poland’s foreign economic activity after becoming a member of the European Union [26–31]:
- Dynamic growth of exports: Following Poland’s accession to the EU in 2004, exports to EU countries increased almost fourfold, indicating the effective integration of Poland into European production chains and the growth in competitiveness of Polish goods and services.
- Structural diversification: Exports are based on machinery, electronics, vehicles, food, and furniture. Poland has become a significant contributor to European production chains, particularly in the automotive, electronics, and agricultural sectors.
- Positive impact on the agricultural sector: Poland has a significant agricultural trade surplus with the EU (over EUR 15 billion in 2022), which provides a stable income for the sector and contributes to the development of rural areas.
- Integration into EU production chains. After joining the Union (2004), automotive components, household electrical appliances, and mechanical engineering became the main export “locomotives” thanks to German and Korean TNCs that localized assembly plants in Poland.
- Shift from raw materials to medium- and high-tech products: The share of iron and steel, as well as mineral fuels, has decreased from 14% (2004) to 6% (2024) due to the modernization of metallurgy, the “green” transition, and energy efficiency projects financed by EU funds.
- Import diversification: In addition to traditional machinery and chemicals, purchases of semiconductors, lithium batteries, and “green” energy from Germany, the Netherlands, and Spain increased in the 2020s, hence the rise in the categories of “electrical engineering” and “minerals/fuels” (critical raw materials for batteries).
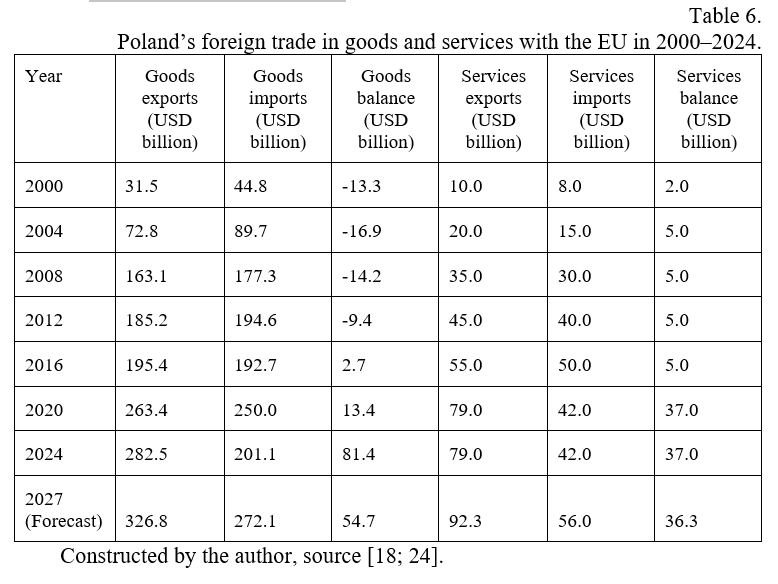
Based on the analysis of the data in Table 6, the key stages in the development of Poland’s foreign trade under European integration can be identified: Initial stage (2000–2012):
Initial stage (2000–2012): Poland demonstrated gradual growth in export and import volumes; however, the trade balance remained negative due to the significant share of machinery, equipment, and energy resource imports from European Union countries.
Main stage (2016–2024): Due to active integration into EU production chains, modernization of the industrial sector, and the development of small and medium-sized enterprises, Poland achieved and has maintained a stable surplus in trade in goods for the first time. Surplus indicators for services with EU countries increased significantly, driven by the dynamic development of transport, information technology, and business services.
Positive impact: Since 2016, there has been steady growth in exports, accompanied by a goods surplus, indicating a strengthening of Poland’s position in the European market for medium- and high-tech products. The balance of foreign trade in services increased sevenfold from 2020 to 2024, confirming the positive trend.
Negative aspects: Despite the established positive balance and significant export volumes, Poland’s foreign trade structure remains vulnerable. This is manifested in the continued significant dependence on imports of technologies and energy resources, as well as the high concentration of exports within three to four main sectors and partner countries.
Forecast stage (2025–2027): In the forecast period up to 2027, exports of goods to the European Union may reach approximately USD 327 billion, driven by sustained high growth rates due to further integration into EU production chains, as well as specialization in electric vehicle, electronic, and mechanical engineering products.
Imports of goods from the EU are expected to total approximately USD 272 billion, with the structure remaining oriented toward high-tech products, pharmaceuticals, and raw materials. The positive foreign trade balance in goods is projected at USD 54.7 billion, indicating the strengthening competitiveness of Polish industry, particularly in the finished goods segment. Exports of services are forecast to reach USD 92.3 billion, dominated by transport, information technology, and financial services. Their growth dynamics are partly explained by the migration of European clientele to Poland’s financial, technological, and outsourcing sectors.
Imports of services are expected to reach USD 56 billion, with the main areas being financial, IT, and consulting services, which will contribute to the modernization of Poland’s domestic market.
The total surplus in goods and services trade expected in 2027 is expected to provide additional macroeconomic benefits, contributing to economic stability and the accumulation of foreign exchange reserves.
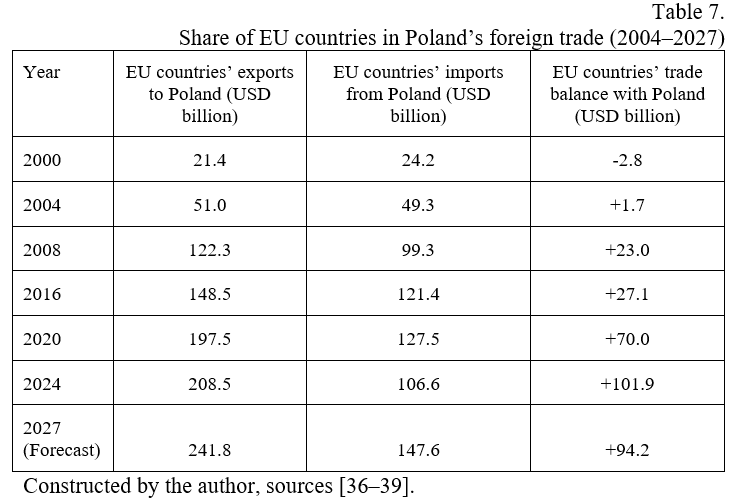
An analysis of Poland’s integration processes into the European Union confirms the decisive role of EU countries in shaping the country’s foreign economic policy. The share of trade with EU countries in the structure of Poland’s foreign trade (2004–2024) is presented in Table 7.
The high share of the European Union in Poland’s foreign trade indicates that, from 2000 to 2024, EU countries remained Poland’s leading trading partners, accounting for 68–77% of total exports and more than 50% of imports. Such stable dynamics indicate Poland’s systemic integration into intra-European markets and reflect the EU’s key role in shaping the state’s foreign economic strategy.
Growth dynamics of foreign trade flows: Over the past 24 years, the volumes of exports and imports between the European Union and Poland have increased more than tenfold. This trend is attributed to the liberalization of trade policy, expanded access to the EU’s internal market, active investment support, and Poland’s integration into European production and logistics networks.
The shift in the trade balance in Poland’s favor after its accession to the European Union (2004) is a clear indication of the progress of the national economy. For the first time, a positive balance of foreign trade in goods with EU countries was achieved in 2016 and subsequently showed a growth trend, which can be attributed to the expansion of exports of medium- and high-tech products. Such dynamics reflect the increased competitiveness and efficiency of Poland’s industrial sector within the European economic structure [33–35].
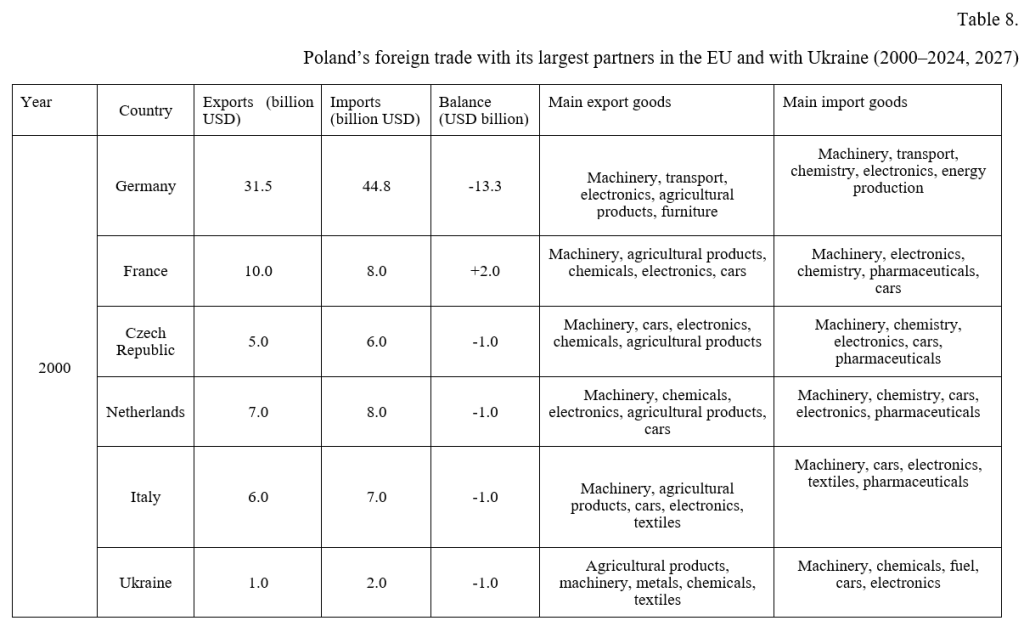
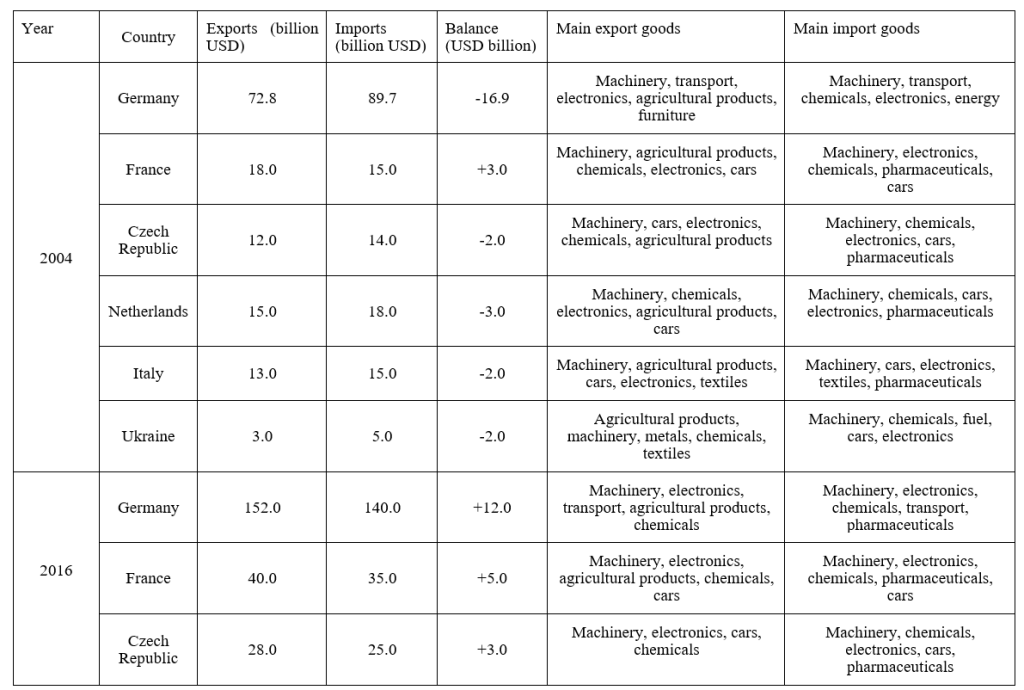
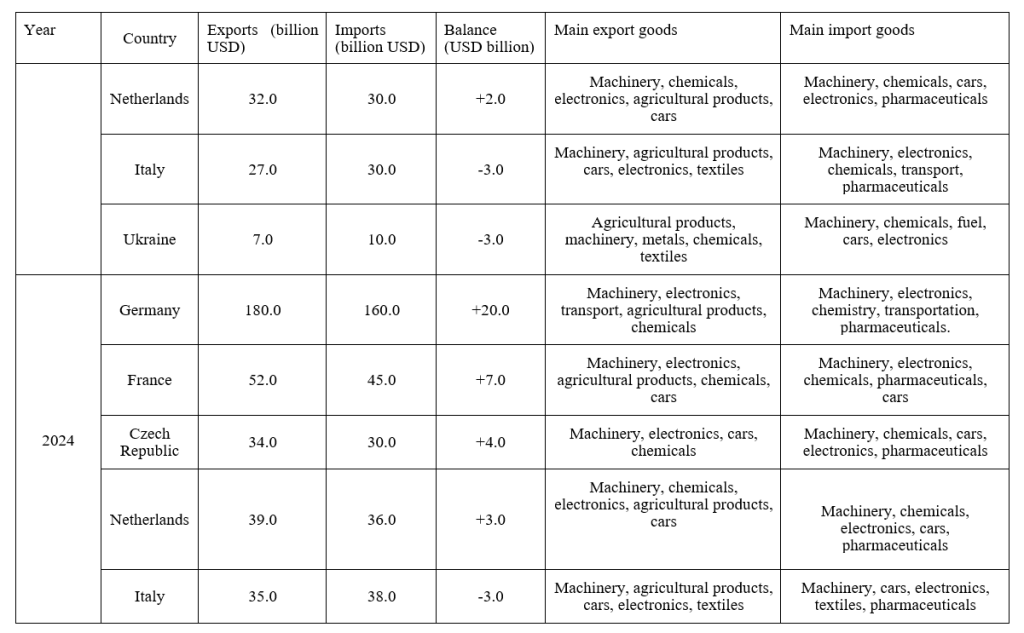
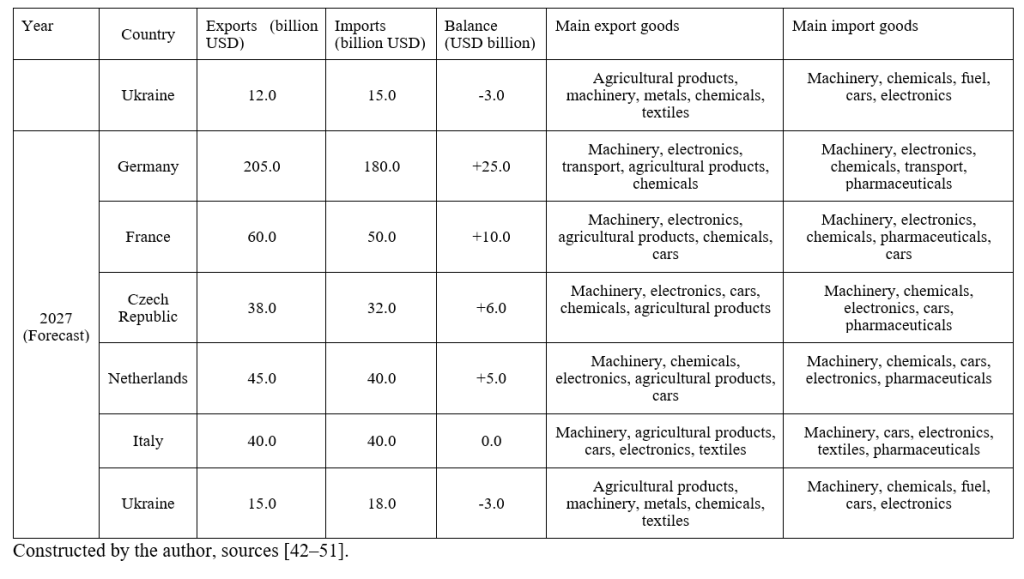
Thus, it can be concluded that the reorientation of foreign trade towards the European Union has become a crucial factor in transforming the Polish economy. The main trading partners of Poland in exports are Germany, France, the Czech Republic, and the Netherlands, while in imports, the main partners are Germany, Italy, and the Netherlands (see Table 8).
In the export structure, there is an increase in the share of mechanical engineering, electronics, the transport sector, and the food industry. A notable trend is the increase in exports of high-tech and finished products, while imports mainly consist of equipment, technologies, and components supplied by leading EU countries.
An analysis of the data in Table 8 reveals that Germany is Poland’s key trading partner, accounting for 27–28% of Poland’s exports and 19–21% of its imports between 2020 and 2024. Other major markets include France, the Czech Republic, Italy, and the Netherlands, which together provide more than half of Poland’s trade turnover with EU countries. The export and import structure is dominated by machinery, electronics, transport equipment, chemical products, and agricultural goods. During the 2020s, there has been an increase in the share of high-tech product exports, including electronics, pharmaceuticals, information technology, and other related products. Poland has integrated into the EU’s production and logistics chains, and the trade balance with EU countries has shown a substantial surplus for the first time since 2016.
When characterizing the forecast indicators for 2027 (Table 8), it is notable that the main factors driving export growth (by 15% compared to 2024) include further expansion of investment in manufacturing, active development of the automotive and instrument-making industries, as well as deeper digital integration with the European Union. The export structure is dominated by mechanical engineering, electronics, the transport sector, and the food industry. At the same time, there is an increase in the share of products related to the “green” transition, including batteries, electric vehicles, and components for renewable energy.
Imports are showing gradual growth (expected to reach USD 180 billion in trade with Germany and USD 50 billion with France). The Polish economy remains highly dependent on advanced technologies from leading EU countries, particularly in the areas of high-tech products, pharmaceuticals, and production equipment, which collectively account for over 50% of the country’s imports from the EU. A reduction in the share of imports of energy resources and fuel is projected thanks to the growth of domestic production and the expansion of LNG imports from the United States and Norway [40; 41].
In 2027, a substantial positive trade balance with Germany, France, the Czech Republic, and the Netherlands is expected to persist. The trade balance with Italy may reach zero due to the reduction of import supplies in the context of the energy transition. In relations with Ukraine, a deficit (-USD 3 billion) remains: food products and light industry goods dominate; however, trade volumes have grown significantly since 2022.
France, the Czech Republic, the Netherlands, and Italy remain historically stable and important trading partners of Poland, with a trend towards an increasing positive trade balance. The main drivers of this process are the expansion of joint production chains and increased demand for Polish mechanical engineering and agricultural products.
In relation to Ukraine, the trade balance remains negative, as imports exceed exports. At the same time, the overall volume of bilateral trade is showing dynamic growth, with significant increases in supplies of agricultural products, metals, textiles, and mechanical engineering products. It is projected that by 2027, trade turnover with Ukraine will continue to grow, in particular due to the recovery of Ukrainian exports and deeper cooperation in mechanical engineering and logistics.
Risks for 2027: A significant threat is the dependence on the economic dynamics of Germany and the EU as the main sales markets, as well as on prices for high-tech products, energy resources, and global logistics chains. Although the share of innovative products in exports is increasing, integration into production chains leaves the Polish economy vulnerable to structural changes in transnational corporations and their products.
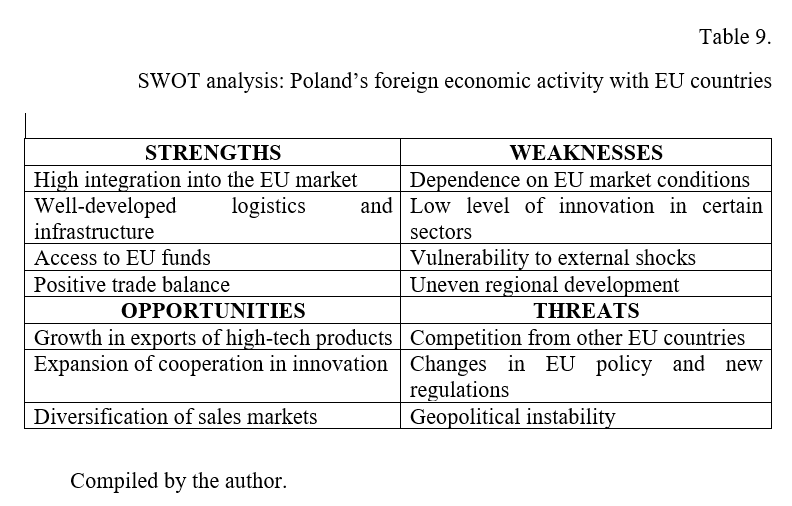
SWOT analysis of Poland’s foreign economic activity with EU countries (Table 9):
1. Assessment of strengths [1–4]:
Poland has gained significant advantages from integration into the EU single market:
– High integration into the EU market provides access to a large consumer base, stimulates export growth, and attracts foreign investment. Well-developed logistics and infrastructure enable efficient transportation of goods across Europe, which is particularly important for the agricultural complex and industrial exports.
– Access to EU funds (annually around 3.5% of GDP in transfers) stimulates investment, modernization of enterprises, and development of innovation.
– A positive trade balance with EU countries demonstrates the competitiveness of Polish products, especially in industry, mechanical engineering, and the food sector.
2. Assessment of weaknesses:
– Dependence on EU market conditions: The Polish economy is sensitive to changes in demand in its main export markets, particularly in Germany and France.
– Low level of innovation in some sectors: Poland has not yet fully realized the potential of high-tech industries, which limits opportunities for long-term growth.
– Vulnerability to external shocks: Global crises, protectionism in the US or other countries, may negatively affect Polish exports, particularly through value chains.
– Uneven regional development: Some eastern regions of Poland lag behind the western ones in terms of investment, infrastructure, and income levels.
3. Assessment of opportunities:
– Growth in exports of high-tech products: Access to the single market and participation in joint industrial and scientific EU initiatives open the way for the development of innovative sectors.
– Diversification of sales markets: Utilization of new EU trade agreements with third countries allows Poland to expand exports beyond the EU.
– Expansion of cooperation in innovation: The EU supports the development of entrepreneurship, technology, and digitalization, which can enhance the competitiveness of the Polish economy.
– Growth in the role of the agricultural sector: Poland is one of the EU leaders in agricultural land area, which enables the development of food and organic product exports.
4. Assessment of threats:
– Competition from other EU countries: Polish producers face competition not only in the domestic market but also in the European market, which requires continuous modernization and quality improvement.
– Changes in EU policy and new regulations: Changes in rules regarding climate, the agricultural sector, and labor migration may affect the competitive advantages of Polish enterprises.
– Geopolitical instability: The war in Ukraine, tensions on the eastern borders, and sanctions against Russia impact logistics, energy, and trade security.
– Workforce outflow: Migration to more developed EU countries creates labor shortages in certain sectors of the Polish economy.
General conclusions:
1. Positive characteristics:
– Poland has become one of the largest exporters in Central Europe, particularly in mechanical engineering, transport, the food industry, and the chemical sector.
– Growth in exports to the EU has contributed to job creation, innovation, and improved living standards.
– The gradual reduction of the deficit and transition to a surplus indicate increased competitiveness of Polish goods.
2. Negative characteristics:
– High dependence on the German market (almost 28% of exports) makes the economy vulnerable to external shocks and market fluctuations.
– Poland imports a significant share of high-tech products and energy resources, maintaining technological dependence on Western European countries.
– External crises (COVID-19, the energy crisis, the war in Ukraine) cause fluctuations in trade volumes and the trade balance.
3. Poland has significantly benefited from EU membership, becoming one of the key players in the European market thanks to its competitiveness, economic openness, access to funds, and joint programs. However, for further growth, it is necessary to address issues of innovation, regional disparities, adapting to new regulations, and strengthening market positions globally. Poland has the potential to strengthen its role in European value chains, particularly in the industrial, agricultural, and innovative sectors, but this requires a flexible foreign economic policy and active participation in EU reforms.
4. Recommendations for Ukraine based on Poland’s experience with European integration [52–55]:
1. GDP per capita growth dynamics:
The problem of the initial gap. Poland demonstrated a relatively rapid narrowing of the gap with the average European level of GDP per capita, which can be attributed to the presence of more developed institutions and market infrastructure at the start of integration. Ukraine, by comparison, has a significantly larger initial gap with EU countries; therefore, the pace of economic convergence may be slower in the absence of large-scale structural reforms.
The risk of uneven development. In Poland’s case, the main drivers of economic growth were concentrated in large cities and western regions, resulting in the formation of regional disparities. For Ukraine, this problem is potentially even more relevant, and European integration may serve as a catalyst for the equalization of socio-economic standards between regions.
2. Budget deficit and public debt:
Growth in the budget deficit and public debt. Similar to Poland’s experience after joining the European Union, Ukraine faces a high likelihood of an increase in the budget deficit and debt burden due to the need to finance structural reforms, economic modernization, social programs, adaptation to EU standards, and co-financing of structural funds. The Polish experience shows that under such conditions, pressure on macroeconomic stability increases, which in turn may limit the country’s investment potential.
The need to ensure fiscal discipline. Meeting the Maastricht criteria, particularly regarding the threshold values for the budget deficit and total public debt, is a fundamental requirement for candidate countries seeking EU accession.
3. The impact of EU enlargement on foreign trade:
Integration into the European Union’s production chains creates conditions for export growth but is accompanied by increased competition from more developed EU member states, which exacerbates challenges for vulnerable sectors of the national economy. Poland’s experience shows a significant increase in export indicators after 2004, but at the same time emphasizes the need for structural transformation and modernization of certain industries to adapt to EU standards. Ukraine, considering its sectoral specifics (metallurgy, agriculture, mechanical engineering), will face the need for deep modernization and increased competitiveness in line with the requirements of the EU single market.
Dependence on certain key export markets can be a factor in potential vulnerability to external economic shocks and changes in the policies of partner countries. Similar to Poland’s orientation of exports toward the German market, concentrating exports on a few key markets may create additional risks for the stability of foreign economic activity in Ukraine.
Table 10.
SWOT analysis of Ukraine’s foreign economic activity with EU countries (based on Poland’s example)
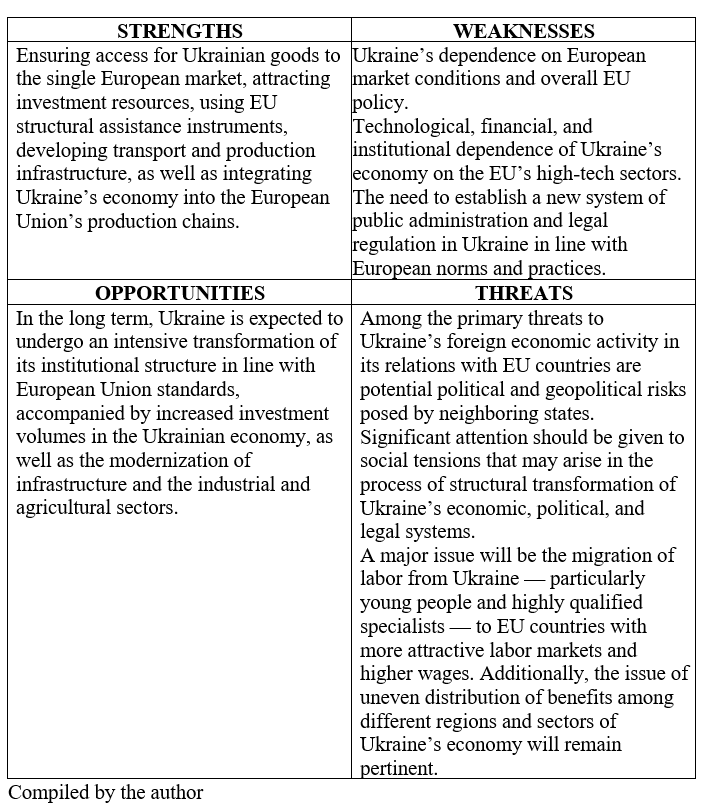
As a conclusion, probable scenarios for Ukraine’s development under European integration, based on Poland’s experience, can be proposed:
1. Positive scenario for Ukraine under European integration based on Poland’s experience [56–59]:
1.1. Key prerequisites:
- Reform of the institutional structure, implementation of anti-corruption mechanisms, and harmonization of Ukraine’s economic regulation in accordance with European Union standards.
- Maximum support from European donors and investors, effective use of EU funds for the modernization of infrastructure, and the development of Ukraine’s human capital.
1.2. Expected results for Ukraine:
- Sustainable GDP per capita growth dynamics: Following Poland’s example, GDP per capita could grow 2–2.5 times over 15–20 years, allowing Ukraine to narrow the gap with the average European level.
- In the event of compliance with the Maastricht criteria, Ukraine could maintain a controlled level of budget deficit and moderate growth of public debt. European investments should be directed mainly towards productive public investments, which will contribute to accelerated economic growth.
- A significant increase in export potential: by analogy with Poland’s dynamics, where exports to the EU more than quadrupled over twenty years, Ukraine would integrate into the European Union’s production chains. The share of high-tech and agricultural products in total exports is expected to grow, alongside an expanded presence in the EU market within the country’s foreign trade structure.
- Strategic advantages in foreign economic activity: Ukraine emerges as an industrial, logistics, and agricultural hub of Eastern Europe, overcoming structural backwardness through the modernization of its economy, thereby reducing technological dependence, stimulating innovation, and securing a stable trade surplus with the EU.
- Substantial inflow of foreign direct investment from the EU and around the world, with increased competitiveness of Ukraine’s small and medium-sized businesses.
- Growth in household incomes, moderate price growth (controlled inflation).
- Accelerated structural transformation — development of logistics, IT, the food industry, and light manufacturing.
2. Negative scenario for Ukraine under European integration based on Poland’s experience [60–62]:
2.1. Key risks for Ukraine:
- Insufficient depth of reforms, institutional corruption, weak implementation of standards, and low efficiency in the use of EU funds.
- Weak strategic planning of systemic reforms and delays in adapting key sectors to the European market’s requirements.
2.2. Probable consequences for Ukraine:
- Moderate GDP per capita growth: Regional and sectoral disparities deepen, the gap with the average European level narrows slowly, and living standards remain low.
- Budget deficit and public debt exceeding target levels: As in Poland’s case, Ukraine faces growing public debt due to “social” spending and the inefficient use of external financing, which provokes budget crises, hryvnia depreciation, and foreign economic instability.
- Vulnerability in foreign trade: Weak modernization leads to the dominance of raw materials and low-tech exports, while competition from EU producers exacerbates the crisis in certain industries.
- Increased dependence on a limited number of markets and import dependence: Exports are concentrated in one or two key markets (for example, Poland or Germany), while imports of critical technologies, raw materials, and equipment increase, exacerbating trade imbalances similar to those observed in Poland during the 2000s.
- A significant inflow of foreign direct investment from the EU and other countries into Ukraine’s small and medium-sized enterprises. However, it should be noted that investment in heavy industry and high-tech sectors of the Ukrainian economy is often unattractive to European and other foreign investors, as it may create potential competition for their own national economies.
- Increased social tension: Accelerated restructuring without compensatory mechanisms triggers mass labor outflows (especially of highly qualified workers), rising unemployment in vulnerable sectors, and worsening interregional disparities.
General conclusion for Ukraine under European integration based on Poland’s experience:
The scenario for Ukraine’s development under European integration will largely be determined by the scale of structural reforms implemented and the effectiveness of utilizing EU mechanisms and financial instruments. Poland’s experience demonstrates that the greatest advantages are achieved by countries that carry out a systemic transformation of the economy, stimulate the development of competitive sectors, invest in human capital, innovation, and infrastructure modernization, and avoid excessive budgetary and trade dependence on a limited range of foreign economic partners.
References:
1. Macrotrends – URL: https://www.macrotrends.net/global-metrics/gdp-per-capita-by-country
2. StatisticsTimes – URL: https://statisticstimes.com/economy/eu-gdp-per-capita.php
3. Trading Economics – URL: https://tradingeconomics.com/country-list/gdp-per-capita
4. Statistics Poland – URL: https://stat.gov.pl/en/topics/prices-trade/price-indices/harmonized-indices-of-consumer-prices-hicp,15,1.html
5. Eurostat “International trade in goods for the EU – an overview” – URL: https://ec.europa.eu/eurostat/statistics-explained/index.php?title=International_trade_in_goods_for_the_EU_-_an_overview
6. Czech Statistical Office – URL: https://csu.gov.cz/external_trade_euae
7. World Integrated Trade Solution – URL: https://wits.worldbank.org/CountryProfile/en/Country/LTU/Year/2022
8. Our World in Data – URL: https://ourworldindata.org/data-insights/polands-gdp-per-capita-has-more-than-doubled-since-it-joined-the-european-union-in-2004
9. Trading Economics – URL: https://gemini.google.com/u/1/app/0e60c147435d760f?utm_source=app_launcher&utm_medium=owned&utm_campaign=base_all
10. World Bank Groupe – URL: https://data.worldbank.org/indicator/NY.GDP.PCAP.CD
11. Statista: “Gross domestic product (GDP) in Poland 2030” – URL: https://www.statista.com/statistics/263588/gross-domestic-product-gdp-in-poland/
12. Macrotrends: “European Union GDP Per Capita” – URL: https://www.macrotrends.net/global-metrics/countries/euu/european-union/gdp-per-capita
13. World Bank Data: “GDP per capita, current US” – URL: https://www.worldeconomics.com/GrossDomesticProduct/Real-GDP-Per-Capita/Poland.aspx
14. Successful Investing in Poland. (2025, May 12). IMF forecast – Poland to overtake Japan, Spain, and Israel in GDP per capita by 2030. – URL: https://successful-investing-in-poland.com/imf-forecast-poland-to-overtake-japan-spain-and-israel-in-gdp-per-capita-by-2030/
15. NextGenerationEU: for a stronger, more resilient Europe – URL: https://next-generation-eu.europa.eu/index_en
16. Economic forecast for Poland, European Commission – URL: https://economy-finance.ec.europa.eu
17. The Polish Sejm adopted the budget for 2024 – URL: https://www.pap.pl/ua/ukrainian/news/seym-polschi-ukhvaliv-byudzhet-na-2024-rik
18. Statistics Poland – URL: https://stat.gov.pl
19. Poland’s new government faces economic challenges: budget deficit in 2024 could reach the highest level since the Covid pandemic – URL: https://unn.ua/news/novyi-uriad-polshchi-zitknuvsia-iz-ekonomichnymy-vyklykamy-defitsyt-biudzhetu-u-2024-rotsi-mozhe-dosiahty-naivyshchoho-rivnia-z-chasiv-pandemii-covid
20. Statista: “Foreign trade goods balance in Poland from 2000 to 2024” – URL: https://www.statista.com/statistics/1095981/poland-foreign-trade-goods-balance/
21. O EC: Poland Trade Profile (2023) – URL: https://oec.world/en/profile/country/pol
22. Statista: Poland’s imports from EU (2000-2016) – URL: https://www.statista.com/statistics/551269/poland-eu-import-value-from-eu-european-union/
23. The Long-Term Effects of Poland’s Accession to the European Union, Studia Europejskie, 2/2024 – URL: https://journalse.com/?download=1&kccpid=7786&kcccount=%2Fpliki%2Fpw%2F2-2024-Michalek.pdf
24. WITS: Poland Trade Data (2020-2024) – URL: https://wits.worldbank.org/CountrySnapshot/en/POL
25. Statista: “Poland’s share of exports between the EU-27 countries 2004-2022, by branch” – URL: https://www.statista.com/statistics/1466534/poland-share-of-exports-between-the-eu-countries-by-branch/
26. Poland Exports By Country – URL: https://tradingeconomics.com/poland/exports-by-country
27. International trade in goods – Statistics Explained – Eurostat – URL: https://ec.europa.eu/eurostat/statistics-explained/index.php?title=International_trade_in_goods
28. Poland in the European Union 2024 – URL: https://stat.gov.pl
29. Poland Imports: Year to Date: Central and Eastern Europe – CEIC – URL: https://www.ceicdata.com/
30. Poland Imports By Category – URL: https://tradingeconomics.com/poland/imports-by-category
31. Poland Trade – URL: https://wits.worldbank.org/CountrySnapshot/en/POL
32. Raw material supplies to third countries increased – URL: https://gmk.center/en/infographic/poland-exported-a-record-2-8-million-tons-of-scrap-in-2024/
33. Annual share of the exports of the European Union to the rest of the world from 2002 to 2024, by member state – URL: https://www.statista.com/statistics/1365715/international-trade-eu-export-share-member-states/
34. Kolodziejczyk K. POLAND IN THE EUROPEAN UNION. TEN YEARS OF MEMBERSHIP – URL: chrome-extension://efaidnbmnnibpcajpcglclefindmkaj/https://www.redalyc.org/pdf/767/76743646002.pdf
35. Poland Country Commercial Guide – URL: https://www.trade.gov/country-commercial-guides/poland-market-overview
36. Poland – Intra-EU trade: Exports – URL: https://tradingeconomics.com/poland/intra-eu-trade-exports-eurostat-data.html
37. Poland: Trade Statistics – URL: https://globaledge.msu.edu/countries/poland/tradestats
38. Poland: Economic and Political Overview – URL: https://www.lloydsbanktrade.com/en/market-potential/poland/trade-profile
39. Poland – Share of trade with the EU: Share of exports to EU – URL: https://tradingeconomics.com/poland/share-of-trade-with-the-eu-share-of-exports-to-eu-eurostat-data.html
40. 20 YEARS OF POLAND IN THE EUROPEAN UNION – URL: chrome-extension://efaidnbmnnibpcajpcglclefindmkaj/https://www.pism.pl/webroot/upload/files/Raport/Report%20PISM%2020%20years%20in%20EU%20..pdf
41. Poland’s foreign trade – Germany remains the main export and import partner – URL: https://poland-accounting.eu/2025/07/polands-foreign-trade-germany-remains-the-main-export-and-import-partner/
42. International trade in goods for the EU – URL: https://ec.europa.eu/eurostat/statistics-explained/index.php?title=International_trade_in_goods_for_the_EU
43. Poland’s foreign trade – Germany remains the main export and import partner – URL: https://poland-accounting.eu/2025/07/polands-foreign-trade-germany-remains-the-main-export-and-import-partner/
44. Germany Exports to Poland – URL: https://tradingeconomics.com/germany/exports/poland
45. Doing business in Poland 2024 – URL: chrome-extension://efaidnbmnnibpcajpcglclefindmkaj/https://www.paih.gov.pl/wp-content/uploads/2024/11/Doing-Business-in-Poland-Investors-guide-2024.pdf
46. Foreign trade turnover of goods in Poland in 2023, by countries – URL: https://www.statista.com/statistics/1070469/poland-foreign-trade-turnover-by-countries/
47. Poland Country Commercial Guide – URL: https://www.trade.gov/country-commercial-guides/poland-market-overview
48. Czech Republic Exports to Poland – URL: https://tradingeconomics.com/czech-republic/exports/poland
49. Netherlands Exports to Poland – URL: https://tradingeconomics.com/netherlands/exports/poland
50. CHALA T. ANALYSIS OF INTERNATIONAL TRADE IN GOODS AND SERVICES BETWEEN UKRAINE AND POLAND USING INTERNATIONAL DATABASES – URL: https://periodicals.karazin.ua/soceconom/article/view/8245
51. Foreign trade relations of Ukraine and Poland: 2022–2024 – URL: https://journals.knute.edu.ua/foreign-trade/article/view/2161
52. Ukraine Remains Resilient – URL: https://www.worldbank.org/en/country/ukraine/overview
53. Spring 2025 Economic Forecast: Moderate growth amid global economic uncertainty – URL: https://economy-finance.ec.europa.eu/economic-forecast-and-surveys/economic-forecasts/spring-2025-economic-forecast-moderate-growth-amid-global-economic-uncertainty_en
54. Foreign trade turnover of goods in total and by countries in January–May 2025 – URL: https://stat.gov.pl/en/topics/prices-trade/trade/foreign-trade-turnover-of-goods-in-total-and-by-countries-in-januarymay-2025,1,157.html
55. The Long-Term Effects of Poland’s Accession to the European Union: A Literature Review – URL: chrome-extension://efaidnbmnnibpcajpcglclefindmkaj/https://journalse.com/pliki/pw/2-2024-Michalek.pdf
56. World Bank upgrades Ukraine to upper-middle-income country – URL: https://visitukraine.today/blog/4236/world-bank-upgrades-ukraine-to-upper-middle-income-country-details?srsltid=AfmBOorCNYC5yJ0OfC4_OZ8fBdwHPQ3mni1BzIoHaYtj0uTRKYhAdbDJ#world-bank-classification
57. Europe and Central Asia – URL: chrome-extension://efaidnbmnnibpcajpcglclefindmkaj/https://thedocs.worldbank.org/en/doc/8bf0b62ec6bcb886d97295ad930059e9-0050012025/related/GEP-June-2025-Analysis-ECA.pdf
58. The Long-Term Effects of Poland’s Accession to the European Union: A Literature Review – URL: https://cejsh.icm.edu.pl/cejsh/element/bwmeta1.element.ojs-doi-10_33067_SE_2_2024_5
59. Poland Country Commercial Guide – URL: https://www.trade.gov/country-commercial-guides/poland-market-overview
60. The European Union’s remarkable growth performance relative to the United States – URL: https://www.bruegel.org/analysis/european-unions-remarkable-growth-performance-relative-united-states
61. European Commission forecasts Poland to lead EU growth in 2025 and 2026 – URL: https://cijeurope.com/en/european-commission-forecasts-poland-to-lead-eu-growth-in-2025-and-2026/post.html
62. Our Europe: 15 years of Poland in the European Union – URL: chrome-extension://efaidnbmnnibpcajpcglclefindmkaj/https://case-research.eu/app/uploads/2024/06/id_plik6170.pdf